
How Corridor Economics Actually Work
FX & Float Memo #5
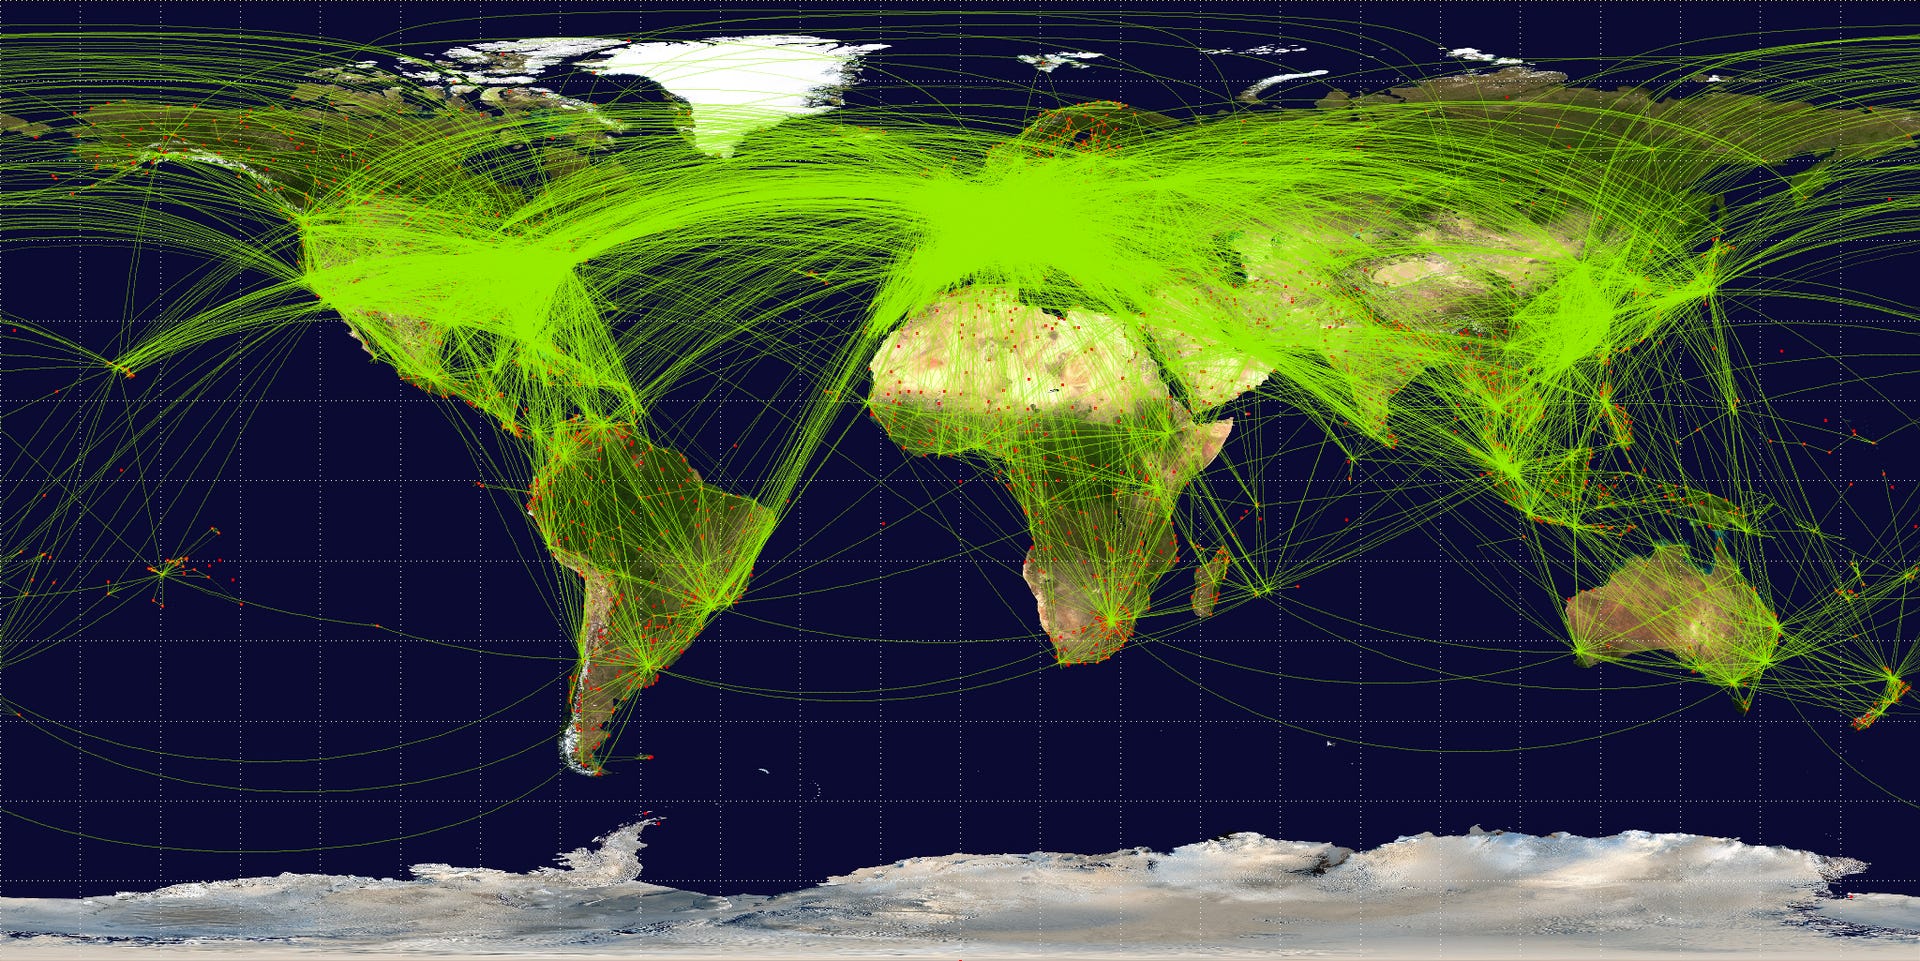
A usual callout on the home page of a payments company says “we support 150 countries”, or something to that effect. This sounds like an impressive claim, but “supporting” a corridor and “operating” in a corridor are different things. The customer-facing difference is minimal, but for the company, it is huge.
Cross-border payments is not a single business. It is more like dozens of businesses stitched together, each with its own cost structure, its own regulatory requirements, its own competitive dynamics, and its own margins. A company that is profitable on USD-GBP can be losing money on USD-NGN, while charging the same fee for both. Understanding why this happens means going deeper into the economics of a corridor.
What most people believe
The common mental model looks at corridors as interchangeable pipes. Money goes in one end; money comes out of the other. The fees, costs, and margins are roughly the same. So, if you support a corridor, you are in that business. If you don’t, it is a coverage gap. As simple as that.
But this is wrong. Two corridors that look identical on the website (same fee, same promised time, same interface) can have completely different cost structures, operational complexity, and margins. Understanding economics at the corridor level is a prerequisite to fully understanding the company’s business.
The six variables that determine corridor economics
Variable 1: Banking partners
Every cross-border corridor needs at least one banking partner on the receiving end to complete the payment. In well-served corridors such as USD-GBP or USD-EUR, dozens of banks are there to process payments. They compete for volume, which keeps costs low and service levels high.
In a corridor like USD-BDT (US to Bangladesh) or USD-ETB (US to Ethiopia), there may be two or three banks willing to handle the payments. Sometimes even one. When a single banking partner controls your access to a corridor, they are in a dominant position and set the terms. This leads to higher prices, lower service levels, and greater concentration of operational risk. If that partner has an outage, or decides to exit the business, or raises their fees, you have no fallback.
Variable 2: FX liquidity
Different currency pairs trade at different levels of market depth. For example, USD-EUR and USD-GBP are among the most liquid currency pairs in the world. The spread between buy and sell is tight, the cost of conversion is low, and the rates remain competitive throughout the day.
On the other hand, USD-NGN (Nigerian Naira) or USD-BDT (Bangladeshi Taka) are thin markets with fewer counterparties. The spread is wider, the cost of conversion is higher, and the rate can move significantly between the customer initiating the payment and the FX being actually executed. This creates both cost and risk.
In thin FX markets, the payments company often cannot source FX as per the rate quoted to the customer. The margin on this transaction gets compressed by market movement. Companies manage this either by building a buffer with a higher spread or by hedging the currency rate. Both of these mitigants add to the cost of operating in this corridor.
Variable 3: Regulatory complexity
Every receiving country has its own regulatory requirements. In the UK and Europe, the framework is well-defined and consistently applied. That makes it simple to navigate it with a standard process.
In countries such as India, Brazil or Nigeria, the regulatory landscape is more complex. India has specific rules on the purpose of inbound remittances that vary by amount and recipient type. Brazil’s central bank has specific reporting requirements on cross-border transactions. Nigeria’s FX regulations change frequently, with sudden restrictions on how the Naira can be received or sent.
Each layer of regulatory complexity adds to the operational cost. It requires local compliance expertise and sometimes even a local entity. Such corridors can require months and months of regulatory work before a single payment is processed.
Variable 4: Last-mile infrastructure
Getting money into a country is the first part of the problem. The second part is getting it to the recipient.
In the UK or EU, the last mile is a bank transfer to the recipient’s account. The infrastructure is standardised, fast, and reliable. In emerging markets, the last mile is the hardest part of the entire chain. In Kenya, the most efficient last mile is M-Pesa, not bank transfer. In the Philippines, many recipients want to collect cash through agent networks. In India, the UPI rail has transformed last-mile delivery, but not all payment companies are integrated with it.
Each last-mile method has its own integration requirements, fee structure, and operating processes. Bank deposits, mobile money, and cash pickup mean working with different partners, different settlement cycles, and different operational risks. Companies cannot just add these options to their offering.
The last mile is very critical for the customer experience. If a payment reaches the country in 2 hours but takes 24 hours to reach the recipient’s mobile wallet, it is not a fast payment. The slowest link in the chain determines the speed of the payment. And that link is almost always the last mile.
Variable 5: Competitive landscape
Some corridors are very competitive with multiple providers. For example, USD-INR has a large number of banks and fintechs operating. Competition reduces margins because customers can easily compare and switch. To maintain margins, the payments company needs either a cost advantage or a distribution advantage.
Other corridors have fewer competitors. A company that builds reliable infrastructure for an underserved corridor (say, GBP to GHS or EUR to UGX) can operate with healthier margins because customers have fewer alternatives. But the trade-off is dealing with lower volume, higher operational complexity, and significant investment relative to the revenue generated.
Companies can choose to compete in high-volume, low-margin corridors with well-established infrastructure, or build in higher-margin, low-volume corridors where barriers to entry are high. Companies that do both often end up with margins from niche corridors subsidising losses in competitive ones, which is not a sustainable structure. This is something they need to watch out for.
Variable 6: Volume in the corridor
Corridor economics have a high leverage on costs. Most of the costs (banking partner fees, compliance infrastructure, technology integration, and pre-funding setup) are fixed. As the volume increases, the cost per transaction drops significantly.
A corridor doing 100 transactions per month might cost $10 per transaction to operate. The same corridor, doing 10,000 transactions per month, might cost $2. This creates a chicken-and-egg problem for new corridors: you need volume to make the economics work, but you need competitive pricing to attract volume.
Most payments companies solve this by subsidising new corridors from the margin of established ones. This is the rational choice in the short term. But if the new corridor never reaches the required volume, the subsidy becomes permanent. This leads to payments companies supporting 150 countries, but only 30 of those have profitable unit economics.
Corridor P&Ls
Each corridor has an implicit (and sometimes explicit) P&L. The revenue side is the total take from that corridor (fees plus FX markup plus float revenue). The cost side includes banking partner fees, FX sourcing costs, allocated compliance overhead, last-mile delivery costs, and the cost of capital for pre-funded accounts.
The margins across corridors can vary widely, even within a company’s portfolio. For a company with flat pricing, a well-established corridor like USD-GBP might have a 60-70% gross margin, while a new or complex corridor like USD-ETB might have zero or even negative margins.
Most payments companies do not measure corridor-level P&Ls. They report blended margins for the corridor portfolio and attribute any changes to “competitive pressure” or “market dynamics.” A good operating practice for payments companies would be to treat each corridor as a separate business having its own margin target, cost-reduction roadmap, and decision criteria for whether to continue operating or exit.
What this means
Corridor economics is the foundation on which all major decisions at a cross-border payments company sit. Pricing, GTM, retention, compliance, and settlement speed: all of these are corridor-specific, not company-wide.
This has three consequences.
First, corridor coverage is an incomplete metric for measuring business effectiveness. The complete picture is: in how many of those countries do you operate profitably, with reliable infrastructure, competitive pricing, and consistent settlement times? Investors and operators who evaluate payments companies on corridor count are measuring the wrong thing.
Second, having corridor depth will beat just having corridor breadth. A company that operates 30 corridors with direct banking relationships, pre-funded accounts, and strong last-mile infrastructure in each will outperform a company that operates 80 corridors through aggregators and correspondent chains.
Third, if you are running a payments company and you do not have corridor-level P&Ls, you do not know which parts of your business are making money and which parts are being subsidised. You are flying blind, relying on blended averages, and averages tend to lie. Companies scale much more profitably when they measure profitability by corridor rather than at the portfolio level.
Every cross-border payments company is a portfolio of corridor businesses. You can manage them as individual businesses, or you can manage them as a blended average. The former approach helps with profitable scaling, while the latter hides the problem until it is too big to fix.